This Chart Shows the Real State of the Global Economy
Actions by various countries and central banks have led to an apparent disconnect between markets and the actual underlying economy. Most would agree that the global economy is in poor shape and that monetary measures (QE, ZIRP, NIRP and so on) have mainly impacted risk. Too much “free” money chasing too few quality assets. Such as junk bonds in the fracking industry, overpriced real estate and overvalued share markets.
To listen to government economists, all is on the up, even if the rate of economic growth is slower than it has been. So a more fundamental picture of global economic performance is needed to understand the economic outlook.
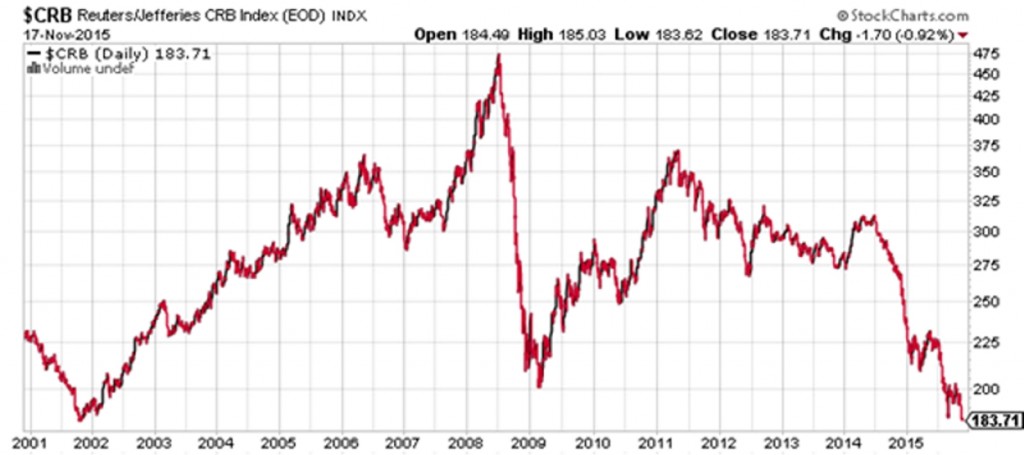
One of the best is shown below. It is the Thomson Reuters/Jefferies CRB Index. It is a commodity futures price index developed in 1957 by Commodity Research Bureau, hence the “$CRB” index. It reflects the outlook for future commodity supply and demand.
It is currently based upon 19 commodities that are all traded on various exchanges. The commodities are: aluminium, cocoa, coffee, copper, corn, cotton, crude oil, gold, heating oil, lean hogs, live cattle, natural gas, nickel, orange juice, silver, soybeans, sugar, unleaded gasoline and wheat.
The picture painted by this chart is an extremely bearish outlook for the global economy. It is the lowest it has been for 15 years, since the dotcom bust.
There are other measure of the real economy, such as shipping rates, that are also bearish. Should these trends continue much longer, no one will escape recession.

