The Gold Silver Ratio – Silver on the Up
In Egypt, in 2700BC, the gold silver ratio was 9. That is, 1oz of gold would buy 9oz of silver. The ratio the fluctuated in a narrow band (typically 10 to 14) for the next 4,400 years. It wasn’t until around 1700AD that the ratio began to rise. It rose steadily through to around 20 before jumping to 75 in 1932 and then 100 in 1940.
The ratio then plunged to 16 in June 1968 before recovering to 42 in 1973. In early 1980 the ratio fell steeply to 15 before rising to 99 in January 1991.
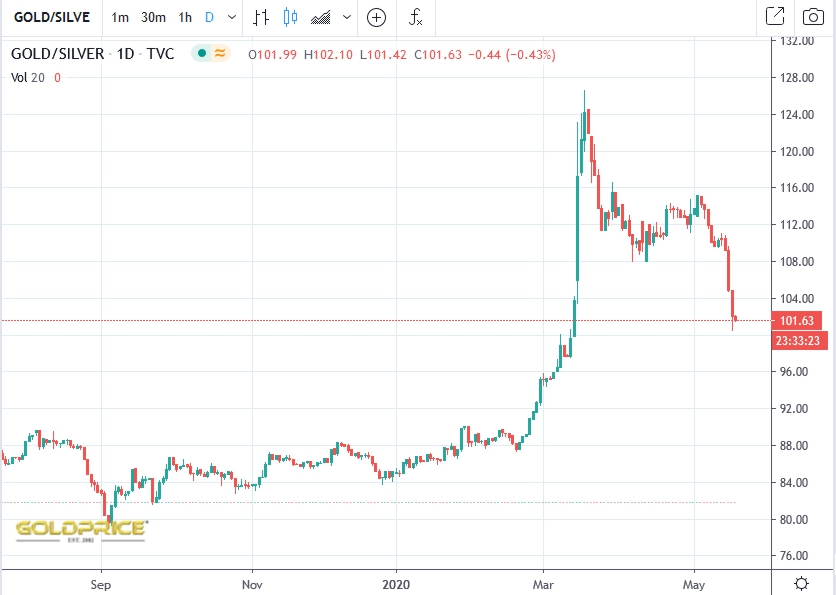
The charts above are both courtesy goldprice.org. The lower chart shows the extraordinary rise in the ratio to 126 in early March. By mid-March the silver price had fallen to USD12/oz, causing the spike in the ratio, today it is trading at USD17/oz. The low for gold in mid-March was USD1462/oz, it is now trading at USD1732.
The ratio at 101 is still historically high, even after the fall from 126. So where to now. If the past is any guide, and if reversion to the mean is applicable, one could expect a substantial decline in the ratio, caused by a rising silver price.
In data from the US Geological Survey, 2019 world silver production was 27,000t and reserves 560,000t. World gold production was 3,300t and reserves 50,000t. Thus, silver has approximately 10x greater production and 10x greater reserves, but the gold price is 100x silver. If this is relevant, there is scope for a substantial revaluation of silver.


