Is Silver Undervalued Relative to Gold
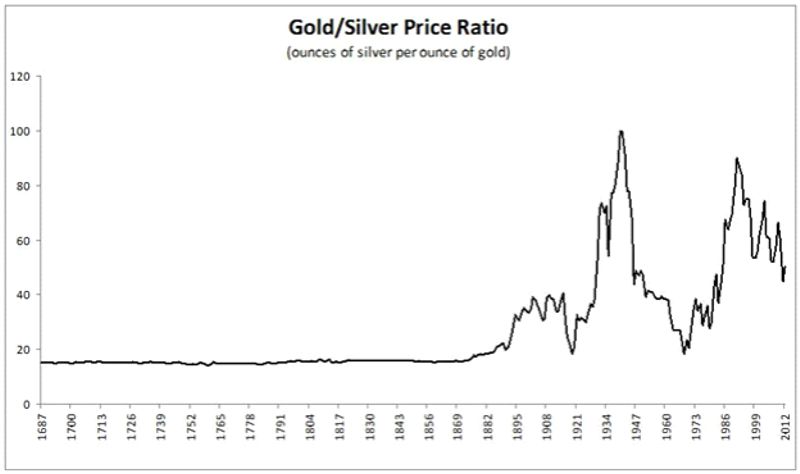
For hundreds of years, up until about 1900, the gold silver ratio was around 16:1, as shown in the chart below. Since then it has fluctuated widely, from about 20:1 to 100:1. At the time of writing it is 80. There is a school of thought that this ratio does not fairly reflect silver value and that at some stage it will approach its long term average.
Chart Courtesy Seeking Alpha
There is some support for this belief. The crustal abundance ratio of gold and silver is around 18-20, the reserves ratio is around 10 and annual production also around 10. This suggests that, geologically at least, silver is undervalued relative to gold.
However, the two metals are not strictly comparable. The World Gold Council estimates that around 187,000 tonnes of gold have been mined throughout history. The vast majority of this gold is still in existence; about half as jewellery and the balance as government and private holdings.
It is estimated that there are less than 100,000 tonnes of silver in the world. The majority of silver that has been mined has been consumed. About 60% of annual silver demand is consumed in industrial fabrication. Primarily in electronics, brazing alloys and photovoltaics.
Much of this silver is never recycled and is lost to landfill. For many years silver has been in supply deficit. It seems that at some stage silver supply will have to increase, which will only happen with a price increase.
Now both gold and silver are considered a store of value and have been used as currency, or as backing for currency, for centuries. And at a ratio of less than 20. I suspect that when gold and silver are once again considered by most to be a store of value, the ratio will approach its long-term average. This is likely to occur when current global monetary policy is seen to be unsustainable.
In sum, silver looks cheap, but it could be quite some time before that changes. The best exposure is perhaps silver developers and producers.

