Commodity Price Cycles are not What They Seem
It is widely accepted that hard commodity prices (metals, minerals and energy) move in long cycles. Each leg, up and down, lasting for 10 to 15 years. It is though that the up leg of the current cycle ended around 2013 and many say we are in the early stage of a commodity secular bear, that will last for at least another 10 years.
The rationale is that soft demand, caused by weak global economies, has combined with dramatically increased supply, which will take years to work through the system. This is extremely bad news for resource dependant economies such as Russia, Canada, Australia and Brazil.
Here is an example of the knock-on effect of lower commodity prices.
Most of the world’s seaborne iron ore ships out of Western Australia. It is home to three of the world’s largest iron ore exporters; BHP Billiton Ltd, Rio Tinto Ltd and Fortescue Metals Group Ltd. All three have dramatically increased production over the last few years, with more increases to come.
Iron ore royalties are a large part of the State’s budget. The State has a budget forecast of USD122/tonne of iron ore for 2015. The price has fallen to USD55/tonne, as a result of weakening demand and much increased supply. This has resulted in much lower royalty income and a budget deficit.
This is a substantial problem for Western Australia. Last week the premier, Colin Barnett, described the expansion in production as “dumb”. “I must say the big iron ore producers have got this dramatically wrong”.
But the two biggest, Rio and BHP, have total costs far below the current price. Lower prices will drive competitors out of business and lead to rising prices. This is not “dumb” business practice. It also suggests that a ten year downturn is unlikely.
Now iron ore, along with coal, is the most extreme example of increased supply. Most hard commodities have seen much smaller supply increases. Some, such as nickel and zinc, may possibly be heading for deficit.
My point is that this may not be the start of a secular bear market in hard commodities. It is a substantial downturn, perhaps comparable with the 1987 downturn in stocks. That ended up being a blip in an ongoing bull market.
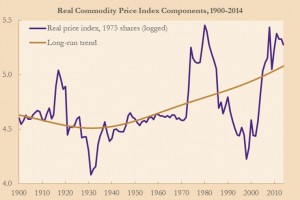
Finally, the chart below shows something that most people miss. Commodity prices move in cycles all right, but there is also an underlying trend that is rarely discussed. The elegant chart below by Dr David Jacks shows cycles and the trend since 1900.
The rising trend is primarily caused by increasing production costs. This is a result of declining grades, deeper discoveries, higher energy costs, increased regulation etc. Thus, we can expect that new lows will be higher than past lows, and similarly for new highs.
Chart courtesy David Jacks, Simon Fraser University and NBER
Conclusion
It is a poor investment decision to avoid an entire sector (resources) because it is said to be in a “secular bear market”. The investor must take trends into account and also the position of particular commodities within the sector. Valuations are already looking good outside of the major players. But the focus should be on advanced projects nearing development, or producers. Exploration companies are unlikely to be attractive for some time.
Finally, take note of what Mick Davis has achieved. He sold Xstrata to Glencore in 2013 and has since raised USD5.6B for X2 Resources, a company formed to invest in the resource sector. X2 investors include very large funds, high net worth’s and sovereign funds. Food for thought.

