Top Ten Australian Gold Miners
The following details are for Australia’s top ten ASX-listed gold companies. Of most interest is the dramatic difference in P/E between the top four and the next five. Note that GOR has only just become profitable and results are only for the first half. A stronger second half will see a lower P/E.
High P/E’s generally reflect stronger future growth and while the top four do have reasonable project pipelines they nonetheless appear expensive. However, much more research is required to form a reliable conclusion. I shall report further in the days ahead.
Newcrest Mining Ltd – ASX: NCM
| Price (c) | 52 Week Low | 52 Week High | Shares (M) | MCAP (M) | Net Profit (M) | EPS ($) | P/E |
| 3071 | 2070 | 3815 | 817 | 25,068 | 750 | 0.92 | 33 |
Northern Star Resources Ltd – ASX: NST
| Price (c) | 52 Week Low | 52 Week High | Shares (M) | MCAP (M) | Net Profit (M) | EPS ($) | P/E |
| 1571 | 885 | 1680 | 741 | 11,640 | 258 | 0.34 | 46 |
Evolution Mining Ltd – ASX: EVN
| Price (c) | 52 Week Low | 52 Week High | Shares (M) | MCAP (M) | Net Profit (M) | EPS ($) | P/E |
| 561 | 328 | 658 | 1709 | 9,585 | 301 | 0.17 | 33 |
Saracen Mineral Holdings Ltd – ASX: SAR
| Price (c) | 52 Week Low | 52 Week High | Shares (M) | MCAP (M) | Net Profit (M) | EPS ($) | P/E |
| 587 | 282 | 675 | 1107 | 6,501 | 189 | 0.17 | 35 |
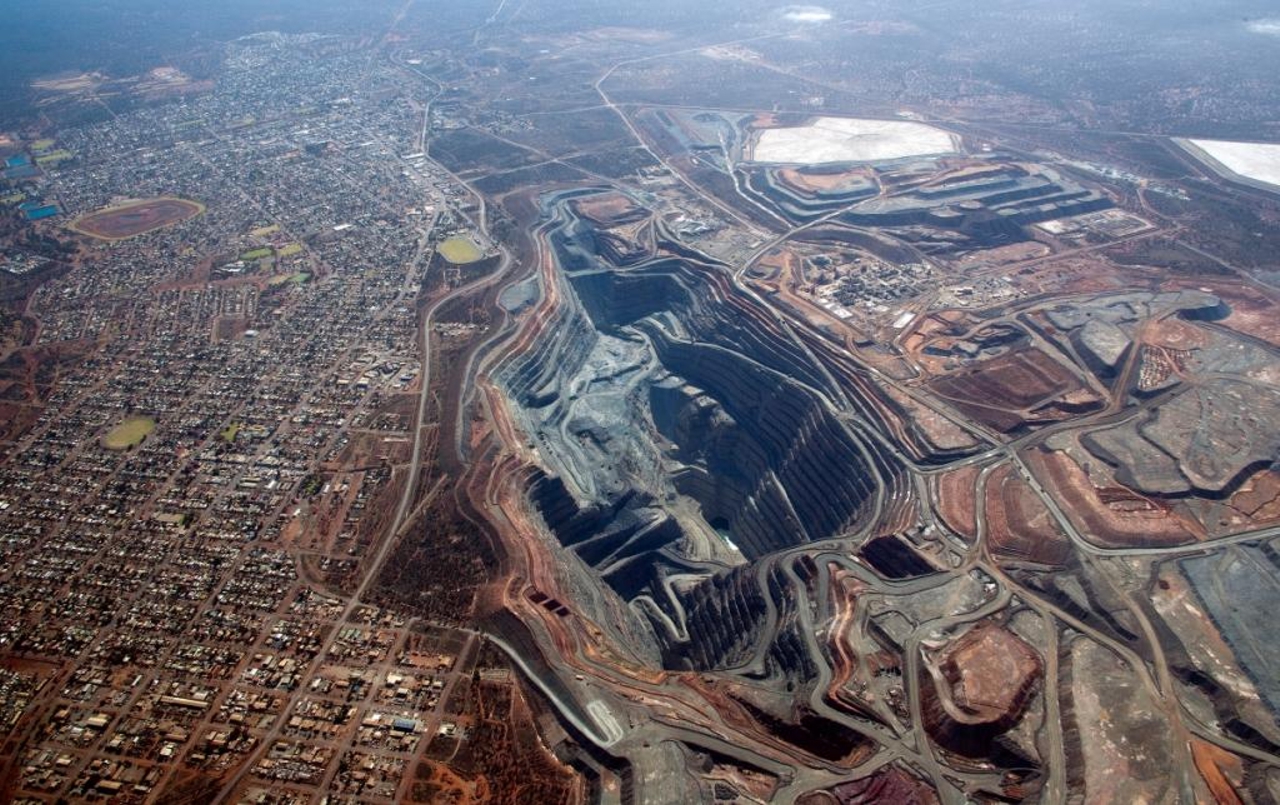
The Superpit in Kalgoorlie operated by NST and SAR – Couldn’t get much closer to the town
Regis Resources Ltd – ASX: RRL
| Price (c) | 52 Week Low | 52 Week High | Shares (M) | MCAP (M) | Net Profit (M) | EPS ($) | P/E |
| 453 | 290 | 618 | 511 | 2,317 | 200 | 0.39 | 12 |
St Barbara Ltd – ASSX: SBM
| Price (c) | 52 Week Low | 52 Week High | Shares (M) | MCAP (M) | Net Profit (M) | EPS ($) | P/E |
| 278 | 161 | 398 | 705 | 1,960 | 128 | 0.18 | 15 |
Silver Lake Resources Ltd – ASX: SLR
| Price (c) | 52 Week Low | 52 Week High | Shares (M) | MCAP (M) | Net Profit (M) | EPS ($) | P/E |
| 223 | 96 | 275 | 881 | 2,000 | 256 | 0.29 | 8 |
Ramelius Resources Ltd – ASX: RMS
| Price (c) | 52 Week Low | 52 Week High | Shares (M) | MCAP (M) | Net Profit (M) | EPS ($) | P/E |
| 199 | 76 | 253 | 808 | 1,662 | 113 | 0.13 | 15 |
Perseus Mining Ltsd – ASX: PRU
| Price (c) | 52 Week Low | 52 Week High | Shares (M) | MCAP (M) | Net Profit (M) | EPS ($) | P/E |
| 125 | 63 | 166 | 1,226 | 1,617 | 94 | 0.07 | 18 |
Gold Road Resources Ltd – ASX: GOR
| Price (c) | 52 Week Low | 52 Week High | Shares (M) | MCAP (M) | Net Profit (M) ½*2 | EPS ($) | P/E |
| 141 | 80 | 202 | 880 | 1,240 | 46 | 0.05 | 28 |


Leave a Reply