ASX Lithium – May 2016 Update – Has The Bell Rung for the Top?
When I posted on the sector last month I had identified 35 companies in the lithium space with a combined market cap of $3.1 B. This month there are 51 companies with a combined market cap of $3.3B. That is, a 45% increase in the number of players over a month, but the combined market cap only increased by 5%. This is a signal of a market top.
It should be noted that there will be other companies in the space that I am not aware of. Essentially, all companies on the list have made one or more “lithium” announcements this year.
Read more on lithium here, here and here.
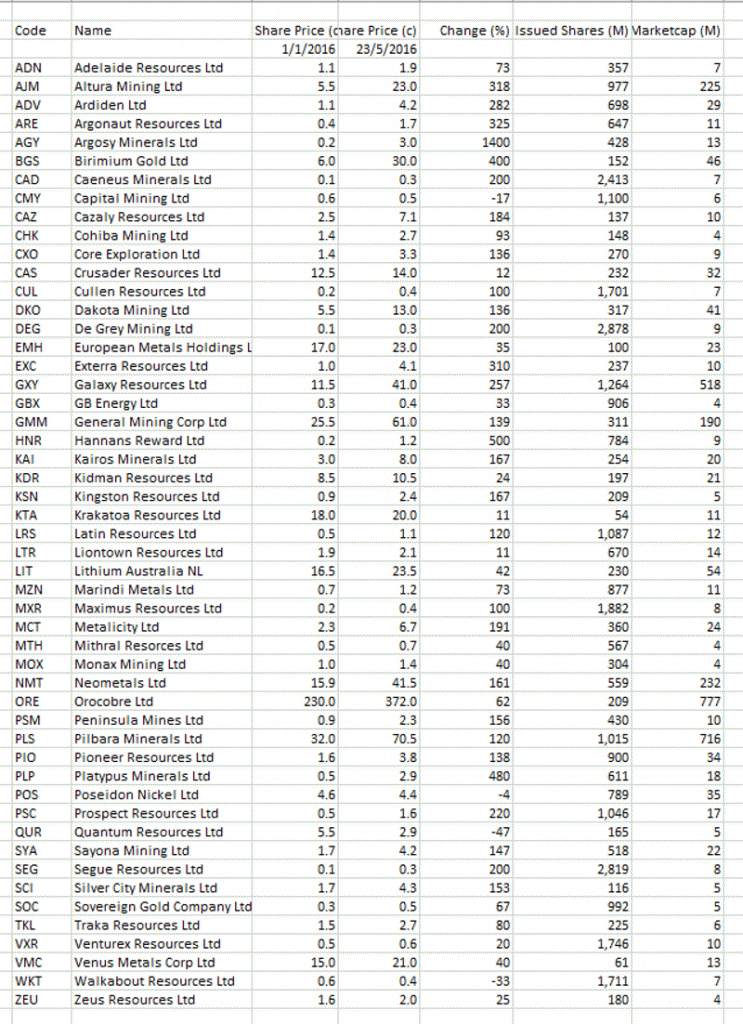
The table below shows the ASX lithium plays with YTD gains and current market cap. Last month the average YTD gain was 209% , it was 159% this month. It is primarily the newer entrants that are dragging the average gain down, in fact two have a negative gain YTD.
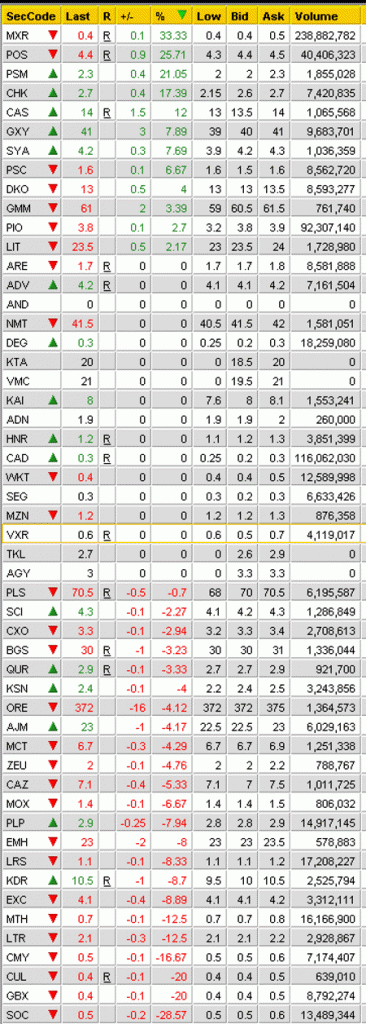
The list below shows the Monday close for these companies, from most up to most down. It can be seen that there is more red than green, a trend that has become more common over the past couple of weeks.
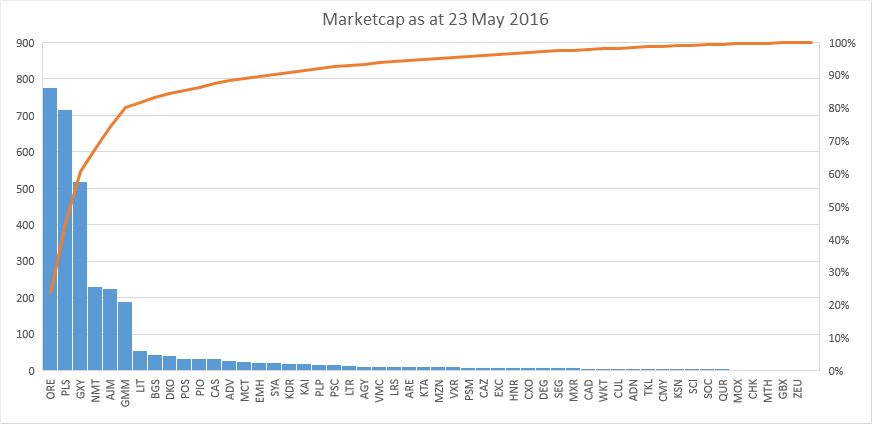
The chart below shows the distribution by market cap. The three leaders (ORE, PLS and GXY) have drawn even further ahead of the pack. The three mid-tier companies (NMT, AJM and GMM) are starting to slip and the tail has become longer and lower.
Conclusion
The risk for investors in this sector is increasing. It is crucial to pick companies with quality, advanced assets. But even then, market cap may not reflect reality. It cannot be predicted how the lithium market will turn out, but existing resources are already abundant.
Personally, I prefer those companies that have other decent assets and have diversified into lithium for a bit of flavour.


