Three Great Charts on S&P 500 Performance Over Time
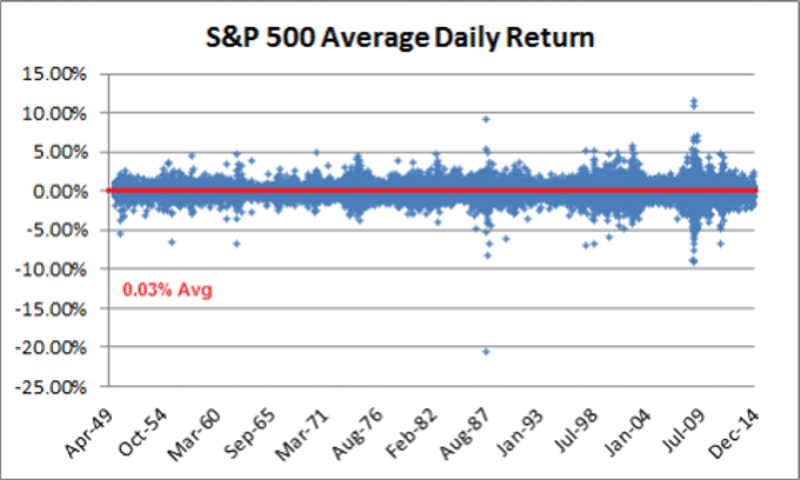
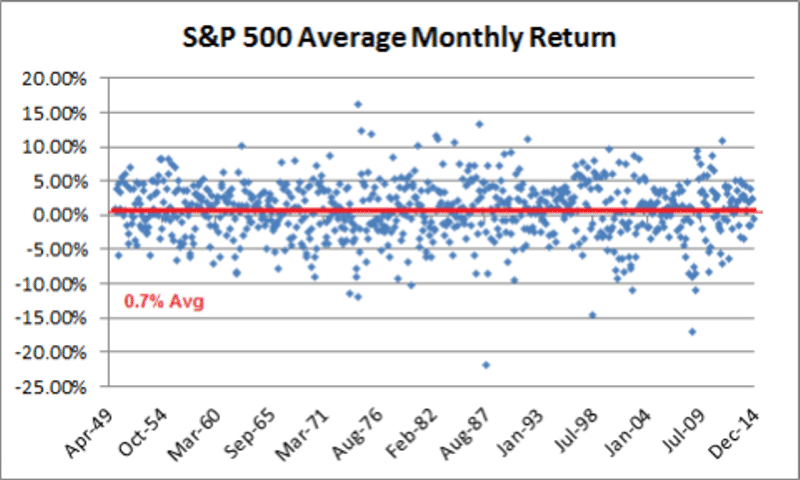
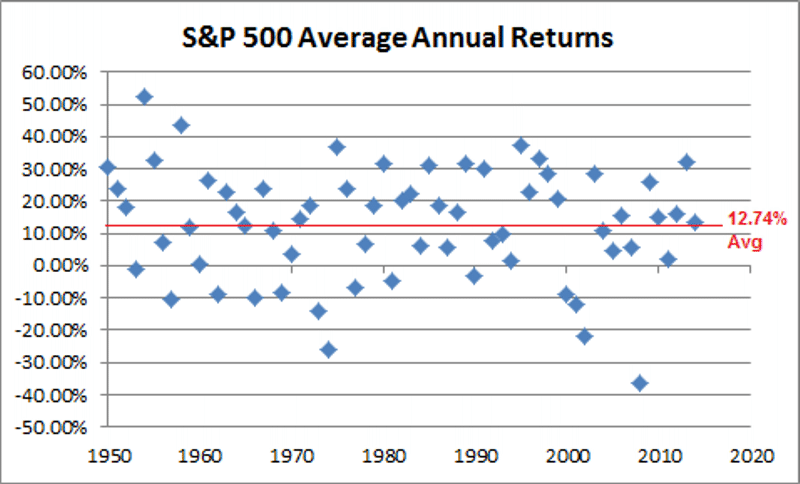
The following three charts show the return on the S & P 500 on a daily, monthly and annual basis. They are reproduced from an article by Cullen Roche of Pragmatic Capitalism. Read the article here.
The average daily and monthly returns are random and negligible. This supports the common view that it is very difficult to beat the market over the short term. The average annual return, while still random, is strongly, positively skewed.
A good example of the perils of short term investing is 1987. It returned a loss of around 20% over daily and weekly periods, but is barely noticeable over the annual period. Against that, performance in 2009 was by far the worst on an annual basis.


