Shale Oil: Does It Have a Future?
Last week Shell announced a USD2 billion write-down of its US shale oil assets and has put its shale assets in Texas up for sale. This follows write-downs by other majors in the shale oil/gas business, such as BHP. These losses have led to a chorus of “I told you so” by shale sceptics. Supporters say these companies overpaid for acreage at the peak of the boom and are now paying the price.
Whatever the outcome, the three charts below should give pause for reflection.
The first two charts below are from J David Hughes’ “Drill, baby, Drill” a detailed paper on unconventional fuels, including shale oil. You can read it here, note that it is long (178 pages) and large (27Mb).
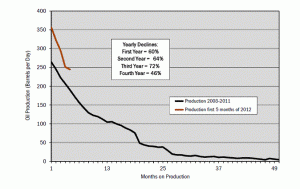
The first shows the extremely rapid decline of production per well (depetion) in the Eagle Ford Shale, one of the three main producing basins.
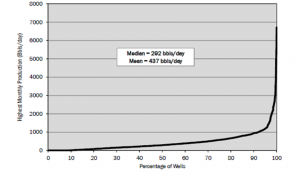
The second shows well quality, with most wells being barely productive. This is because the only meaningful production from the basins is from comparatively rare “sweet spots”. The location of sweet spots cannot, at this time, be determined prior to drilling.
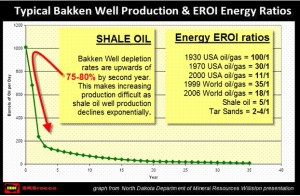
The final chart below is from the North Dakota Department of Mineral Resources, Oil and Gas Division. This is an interesting site and worth a visit.
It covers another large US shale oil basin, the Bakken basin. It also shows the very rapid depletion per well along with Energy EROI (Energy Return on Investment) ratios. It can be seen that the return on shale oil is much lower that the return on conventional oil and gas.
Last Word
Although shale oil appears to have a future, flow rate are low and costs are high. However, returns may improve with advances in technology, for example being able to locate sweet spots prior to drilling. Profitability will, of course, be closely tied to the oil price, which I suspect will need to be higher than at present to ensure continuing shale oil investment.


