The Fragile Australian Economy
Australia’s last recession was in 1991. The Australian government believes that the long run of growth shows they are doing a great economic job and the country is in good shape. But looking a little deeper tells a somewhat different story.
The state of the Australian economy is directly related to the rise of China. Australia is a large, empty country with a wealth of mineral and energy resources. One third of Australia’s merchandise exports, mostly minerals and energy, goes to China. This is comparable to countries such as Gambia and the DRC.
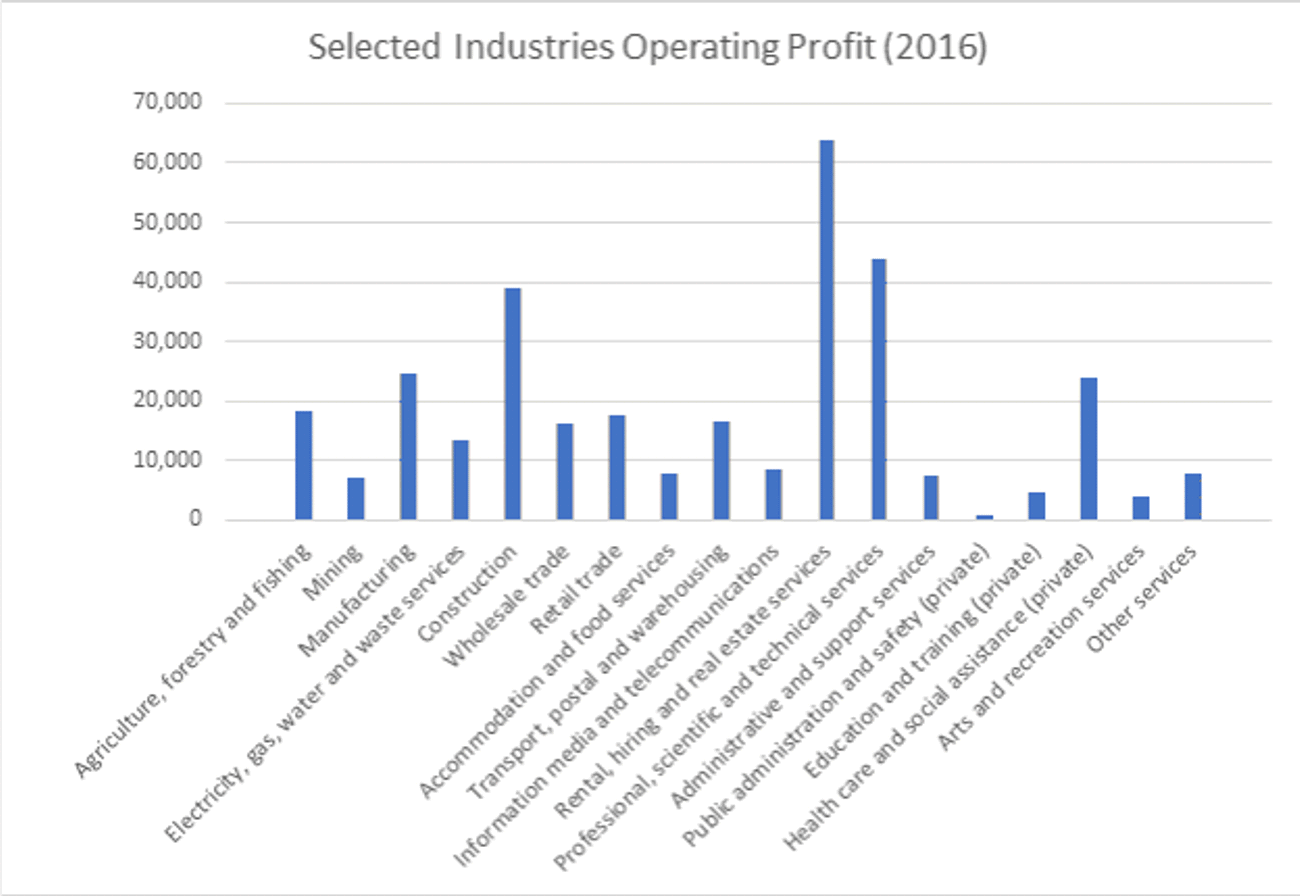
The chart below shows profit from various sectors (Australian Bureau of Statistics data) of the economy. The largest sector is real estate ($63B), then services($43B), with construction (virtually all residential building) in third place ($38B). Note the miniscule contribution from mining; and the manufacturing contribution is not much better.
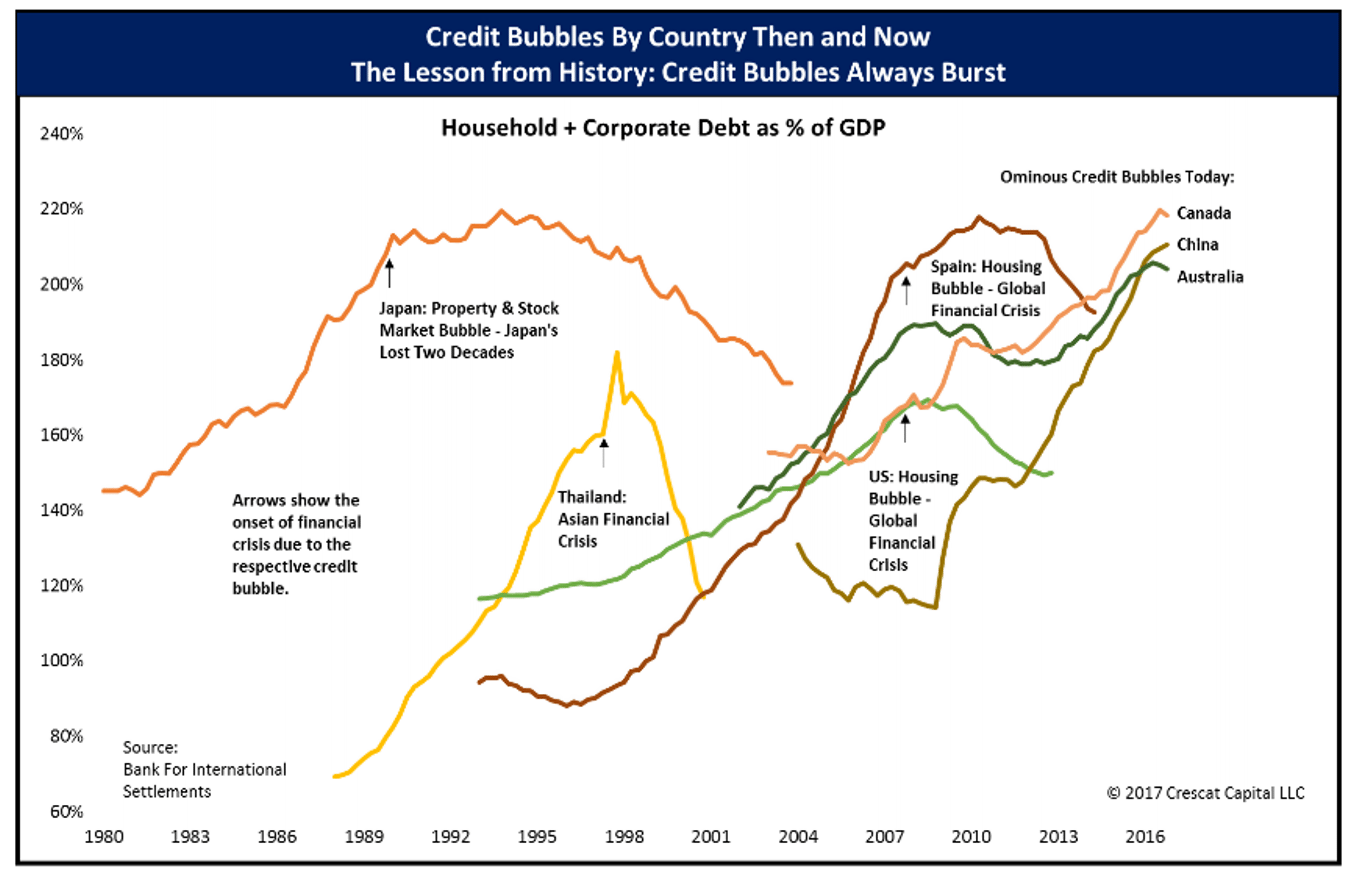
This is not the structure of a strong, first world economy. Any downturn in China will be disastrous for Australia. The chart below, from an excellent report by Crescat Capital LLC (read the report here), suggests that China, along with Canada and Australia, are at or near the peak of a debt bubble.
Australia and Canada are large suppliers of the raw materials that have fuelled China’s housing and infrastructure boom. In turn, Chinese speculators have contributed to housing bubbles in both countries.
Australia now has the largest property bubble in the world, read about that here.
This bubble has been encouraged by the Australian government. For example, at the time of the GFC, the First Home Buyers Grant was doubled. It is now $10,000 in NSW, where there are also exemptions from stamp duty; $27,290 for a house worth up to $790,000. Investors also get tax breaks where income does not cover costs. They are able to deduct the loss from other income before paying tax, this is known as negative gearing.
The banks are also complicit, once lending up to 100% with no deposit and interest only repayments. This has been tightened recently, but only a little. It is possible to use equity gains on an existing property as a “deposit” on a further property. So, this all leads to huge leverage in the Australian property market.
Demograhia International considers that a median house price to household income ratio of 3.0 or less is affordable. In Sydney that ratio is 13x, out of reach for most people.
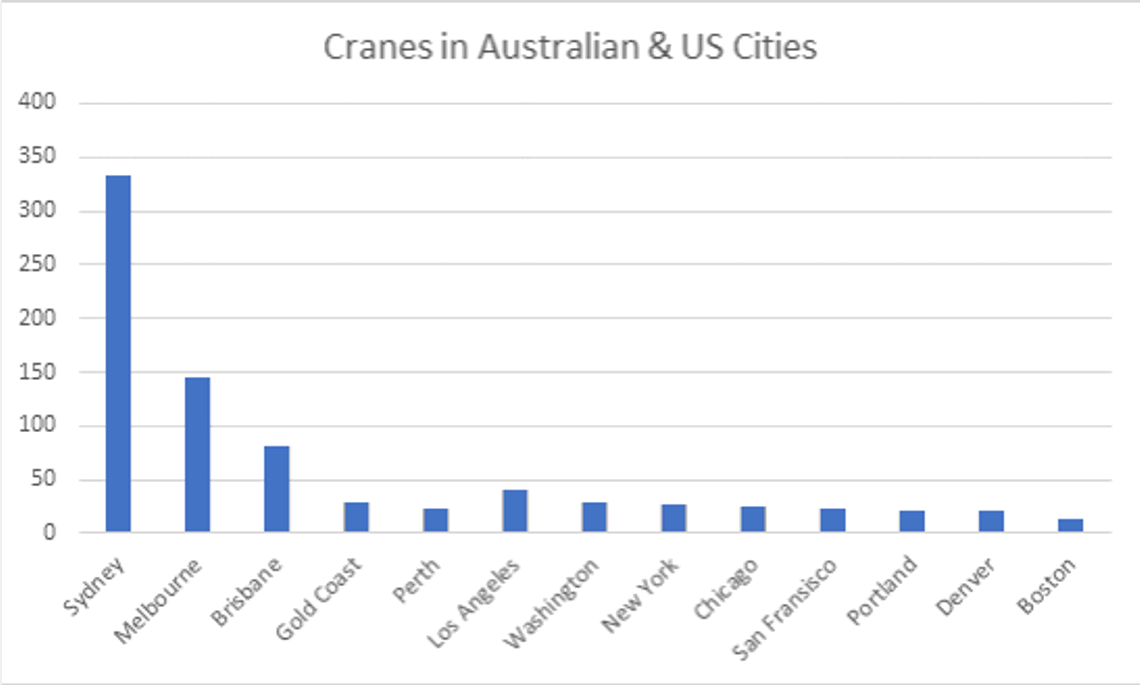
On the assumption that there is no bubble to be seen, developers are building houses and apartments at an ever-faster rate. The chart below shows the number of construction cranes in selected Australian and US cities. There are 334 cranes in Sydney compared with 40 in Los Angeles. In fact, there are almost twice as many cranes in Sydney as in all major North American centres combined.
It is estimated that all this construction activity in Australia accounts for a large part of GDP. Thus, the economy is mostly comprised of people building, buying and selling houses and apartments to each other.
The Federal government is aware of the situation, but can do nothing but keep interest rates low. It is on record as saying that immigration will take care of oversupply, but those potential immigrants would need to be well-off to afford Australian property.
Interesting times ahead.


