This Chart Suggests Oil Prices Will Either Rebound or The World is Headed for a Serious Recession
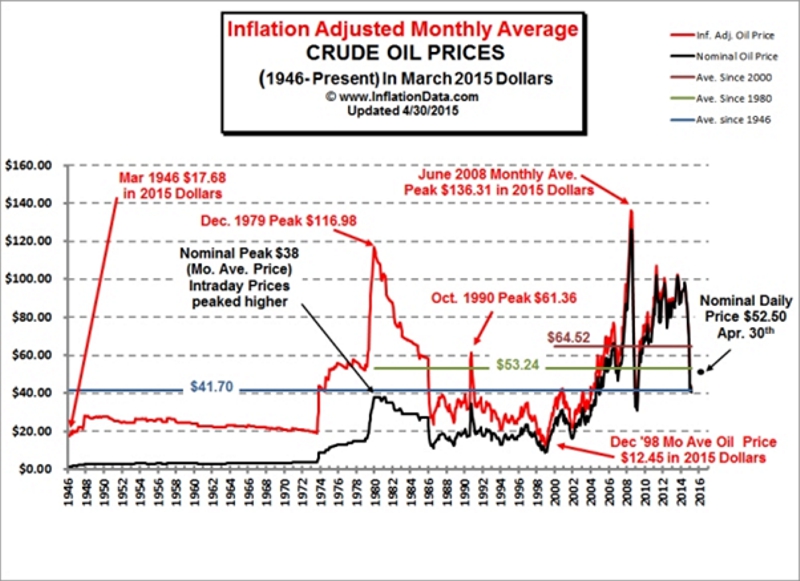
The chart below, courtesy of inflationdata.com, shows the oil price in both nominal and real, inflation adjusted, dollars. The oil price used is Illinois Crude, which is worth slightly less per barrel than West Texas Intermediate (“WTI”). Today’s price for WTI is USD30.74/bbl (“per barrel”), which, in constant dollar terms, is lower than the average price of USD41.70/bbl since 1946.
Perhaps the most interesting thing about the chart is that average real prices are higher, the shorter the time from the present. Thus, the average for the 2000-2015 period is USD64.52/bbl. If this trend holds then we could expect a rebound perhaps to around USD 60/bbl. Alternatively, if the real price does not recover over the next year or two, then global demand will have remained soft. This will be a harbinger of a more serious recession than many are predicting.

