Is the Baltic Dry Index a Leading Economic Indicator
Many economists believe that a measure of global shipping activity, such as the Baltic Dry Index, is a reliable economic indicator. The primary reason is they believe that the supply of ships is inelastic and thus movements in the index are a measure of demand only. They also often believe it is a measure that cannot be manipulated because there are no derivatives. First some background on the index itself.
The Baltic Dry Index (“BDI”) is one of several indices measured and published by The Baltic Exchange. The indices are used by members for “trading and settlement of physical and derivative contracts”. It is important to note that there are derivatives of the indices.
The BDI is an assessment of the cost of moving raw materials by sea over 23 of the world’s major shipping routes. Raw materials include commodities such as iron ore, coal and grain. The chart below shows the BDI for the past 12 months.
About The BDI
The index is comprised of four sub-indexes covering four ship sizes: Capesize (100,000+ Dead Weight Tonnes); Panamax (60-80,000 DWT); Supramax (45-60,000DWT); Handysize (15-35,000DWT). DWT is a measure of how much a ship can carry including cargo, fuel and ballast. Capesize vessels are too large for the Suez and Panama Canals and so must use the Cape of Good Hope or Cape Horn.
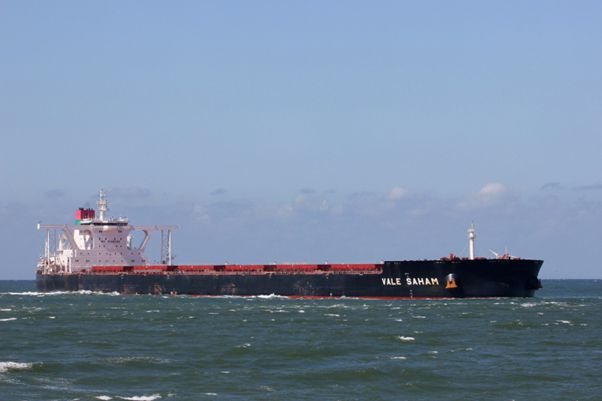
The 200,000DWT Capesize Ore Carrier Vale Saham. Photo courtesy Hannes van Rijn
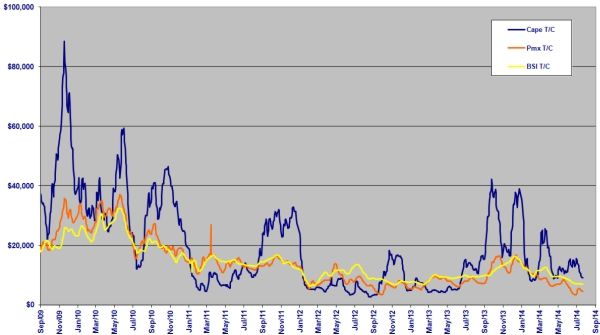
The chart below shows BDI rates for Capesize, Panamax and Supramax as of August 2014. The chart shows the average of various Time Charter (“TC”) rates for each size. These TC rates range from 6 months to five years out and are hugely variable over time. The rates for each size can also vary widely, thus reducing the value of an index that averages the four sizes.
Another factor that is averaged is the difference between Atlantic and Pacific Delivery. For example, for a Capesize charter 4-6 months out the Pacific rate is UDS18,750 per day and the Atlantic rate is USD24,750 per day. The price of bunker oil, a major cost, also influences rates.
The point is that the BDI index is composed of many variables and it may therefore not be a reliable indicator of worldwide supply and demand other than in very specific instances.
Chart courtesy Dry Ships Inc
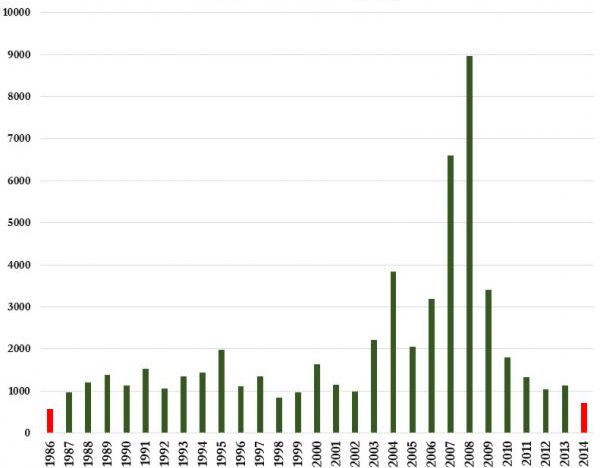
Nonetheless, the BDI is certainly well below its peak as shown in the chart below. This chart shows the index for July, being one of the busiest months of the year. It is now about the same level as it was at its inception, in 1986. When you consider that it is calculated in nominal dollars, in real terms it would be much lower.
Chart courtesy of Zero Hedge
Supply
What the chart also shows is the extremely high charter rates reached during the 2004-08 boom. These prices encouraged shipping companies to build bigger, more efficient carriers and to scrap smaller, older ships.
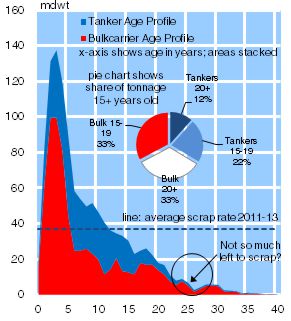
The chart below shows the result. There are a huge number of near new bulk carriers (and tankers), and very few left at the typical scrapping age of 25 to 30 years. New ships take about 2 years to build and require large capital expenditure. Depreciation on ships is therefore very high. For a large Capesize it could be over USD12,000 per day. Compare that with the daily rates quoted above.
Courtesy Clarkson Research Services
All of the above clearly demonstrates that bulk carriers are in over supply. Worse, there are very few ships suitable for demolition so the oversupply could last for some time. As a consequence, many shipping lines will continue to lose money.
Demand
A 2014 paper by Ghiorge Batrinca and Gianna Cojanu derived an empirical relationship between BDI supply, demand and world GDP. In brief, it showed that shipping rates were much more strongly influenced by supply than by demand.
Towards the end of 2013 (see the Bloomberg chart above) the BDI was showing strong growth. Many economists believed this indicated that world GDP would soon be rising. BDI measures raw material shipments, it was rising because of increased demand. Because the raw materials are precursors to manufactured goods, we would soon see an uplift in world GDP, they thought.
Since then the BDI has dramatically declined, helped along by factors such as Indonesia’s ban on shipping bauxite and nickel.
Conclusion
The BDI is not a crystal ball that shows the future of world growth. It is a measure of the supply demand equation and supply is more influential than demand. External factors, such as the oil price, or Indonesia’s actions, can dramatically influence the index with no relation to GDP growth. There are BDI derivatives and these can be “manipulated” just like any other derivative.
I strongly recommend NOT making investment decisions based upon what the BDI is doing at any given moment. It is not a leading economic indicator.


